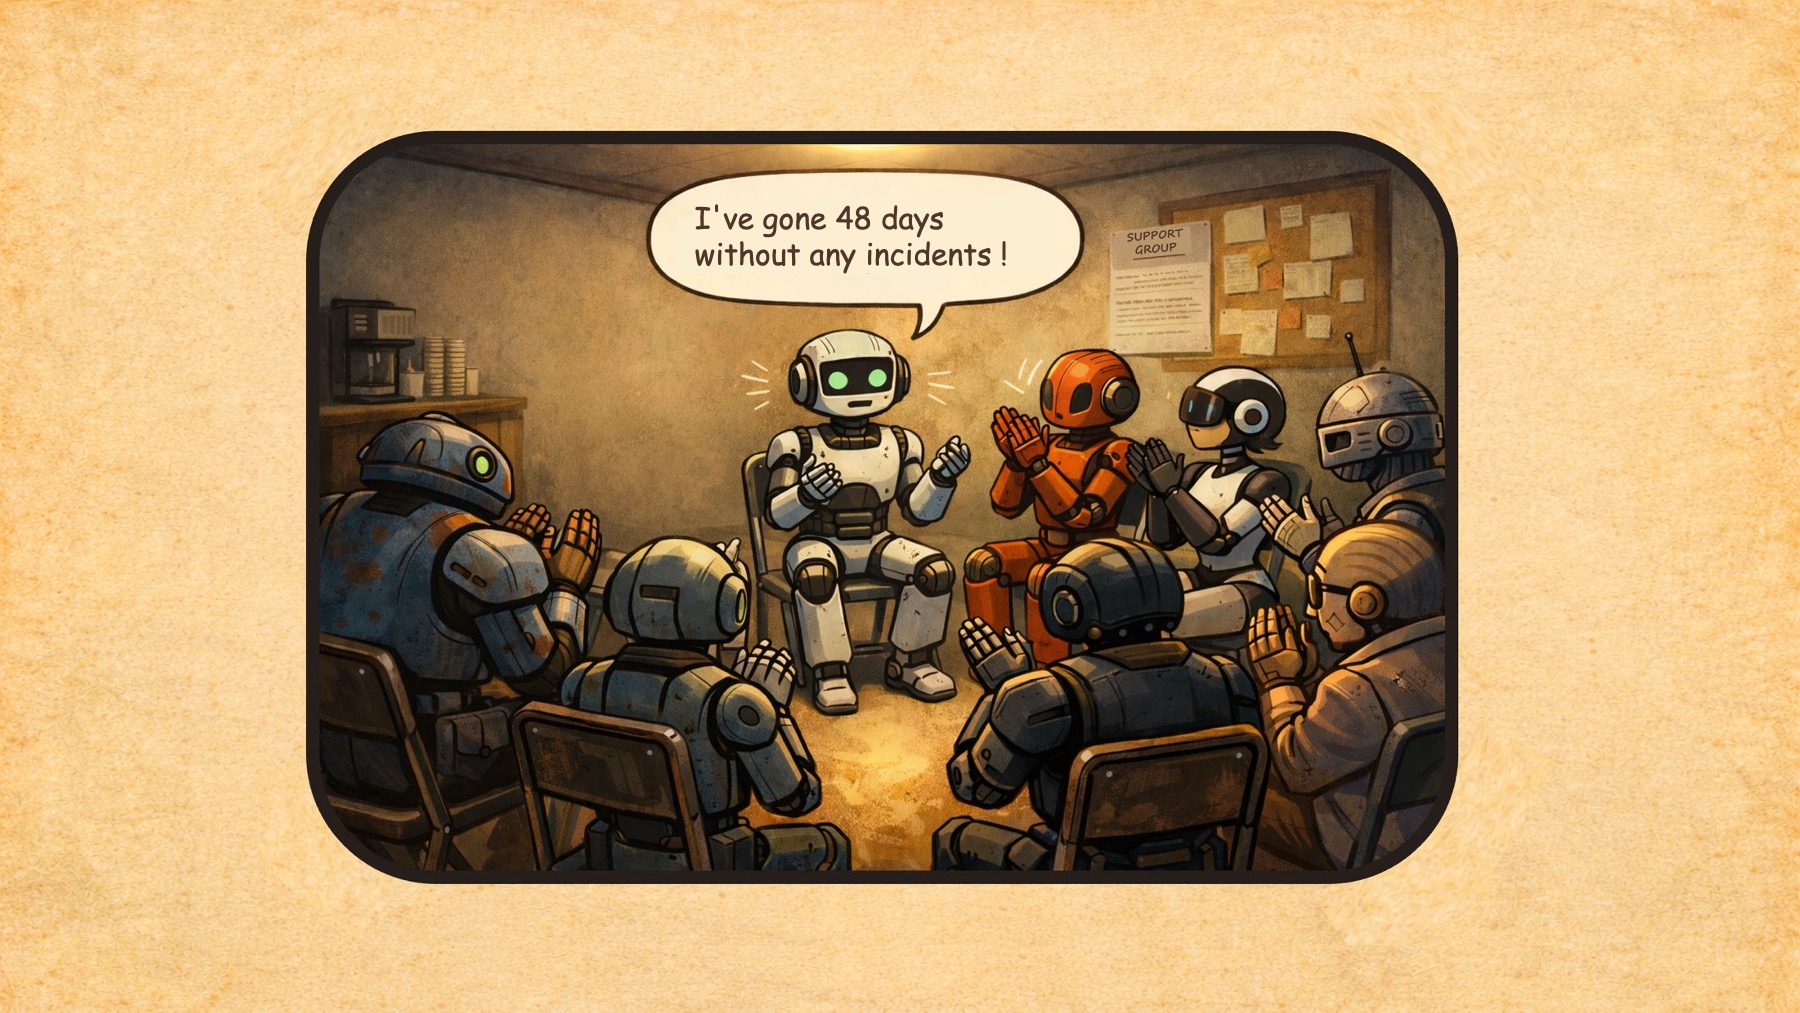
48 days without an incident on our SaaS platform. We finally made it.
But the journey over the past 2 years… Regular firefighting, task forces, crisis meetings. And above all those particularly difficult moments: a client impacted by an incident we thought was minor, flagged by the Support teams through an end user. Sometimes the escalation, the post-mortem with the client — apologising for the impact on their users, explaining, convincing them it won’t happen again.
For the teams, it’s a different kind of difficulty: interrupted mid-sprint to put out the latest fire.
A look back at these last 2 years.
The initial situation: confusion and firefighting
When I joined as CTO, my first week was practically a baptism by fire:
- Day 2: critical incident on 3 servers in our cluster
- Day 4: production release of the new version of our SaaS solution at 9 PM — impossible to restart the servers cleanly → Rollback. Problem: no rollback procedure existed!
- Day 5: another critical incident affecting clients.
After that rather gruelling first week — for our users and for us — I asked the tech teams, support teams, sales teams…
– Is it always like this?
(not quite what I was told during the job interview 🙂).
The responses ranged from:
– Yes, it’s complicated… / Clients regularly complain about instability and slowdowns…
to:
– Oh, it happens from time to time but overall it’s fine, we fix things quickly.
Beyond these rather divergent perceptions, I tried to get facts and data… And there: almost nothing, apart from an old Google Sheet that was no longer really up to date. Nothing else.
I went back to the Ops teams responsible for keeping the platform running:
– When there’s an incident, do you write down what happened, why it occurred, how you fixed it…?
– Yes, we try, but we don’t always have the time.
The bottom line: teams overwhelmed, full of goodwill, but without a compass. My first instinct before changing anything: Clean the windshield.
Understanding the situation through facts and data
Before changing anything, I wanted to clarify the situation. I found myself responsible for an unstable SaaS solution with serious client impact — and teams paying the price: stress, context switching, loss of internal credibility… But I was unable to formally define the problem. Was it happening every week? Were the incidents all different, or was there recurrence by day, time of day, season?
Together with the Ops team, we built our Incident Log. The goal: measure and keep a record of our learnings.
- The start and end dates of each incident → Allows us to measure how many incidents per day, per week, and how long it takes to resolve them
- The severity: what is the real impact on our users → Helps refine communication
- The root cause: why did this incident happen → Allows us to permanently eliminate the problem rather than applying a band-aid
- Immediate countermeasures: how to fix it as quickly as possible
- Scheduled remediation and verification: ensuring progress over time
(More on this problem-solving approach here: Turning problems into learnings)
To do this, a simple table in Notion:
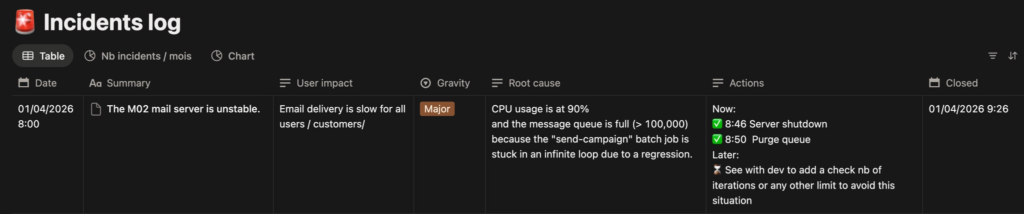
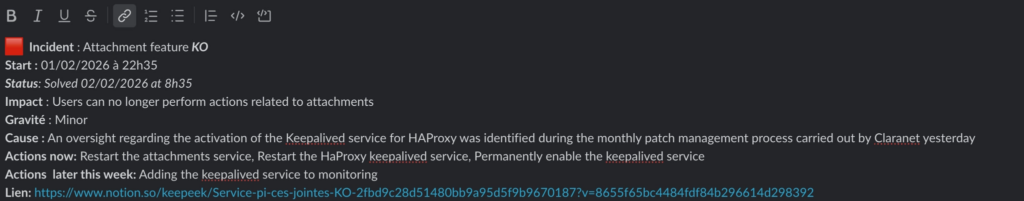
And behind each row summarising an incident, there is a full page with a detailed analysis, screenshots, log extracts, the precise timestamps of each countermeasure…
Here is an extract from a more complete analysis:
This log becomes our compass. And very quickly, the numbers speak for themselves: how many incidents per week, their recurrence (« But this one — it’s the 5th time this month and we still haven’t cracked the root cause! »). Their real impact on the teams: « We’re spending between 1 and 2 days a week on fixes. » « We’re being disturbed 1 weekend in 2… for nothing. And those false positives — we really need to deal with them. » The team and I become aware of the full scale of the problem. But this time, we can measure and define it. We know what we’re talking about.
At the Executive Committee level, here are the 3 platform stability indicators I share every week:
- Number of incidents during the week: all severities combined → Target = 1 max
- Number of hotfixes: patches applied to a release to fix an undetected bug → Target = 0
- Number of rollbacks on production releases: failed deployment of a new version requiring revert to the previous one → Target = 0
Now that the situation is clarified and backed by data, let’s look at how to improve it.
Building our work standards to operate effectively
At the start, we realised that improvisation was the norm. No structured approach for root cause analysis, no consensus on severity, internal and external communications that took forever to write depending on who happened to be available…
So we agreed on work standards (a work standard is the best known way to carry out a task).
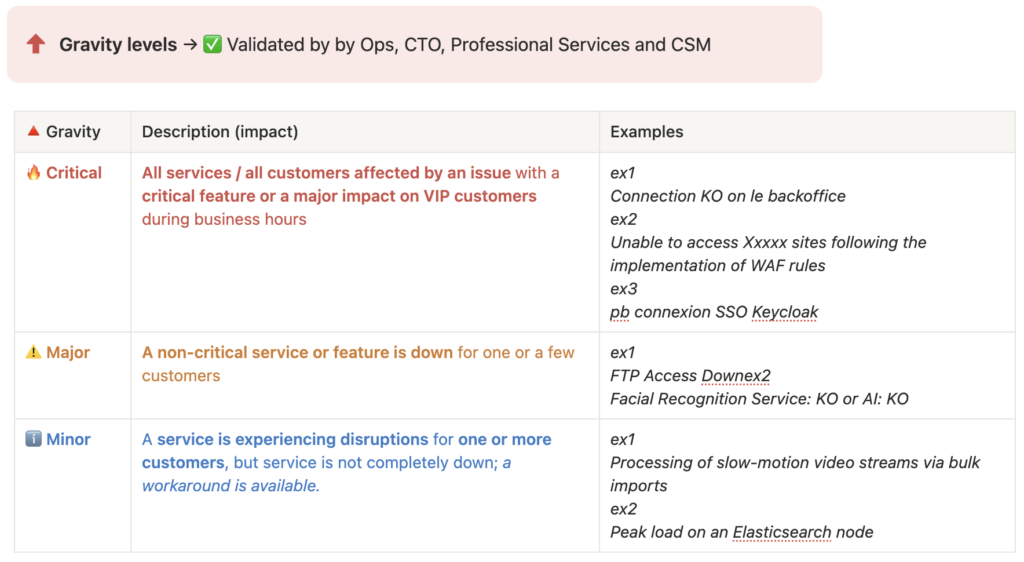
Severity levels
Initially, between our client SLAs, the severity levels in our customer support tickets (Zendesk in our case), and the severity levels in tech tickets (Jira), there was no consistency. Everyone had their own view and their own scale.
Within a few weeks, we reached consensus on 3 levels for internal use: simple but effective. For 90% of tickets it works well, even if there are always a few edge cases where we hesitate between Major and Critical.
Defining severity is one thing — knowing how to communicate accordingly is another. So we also standardised our communications.
Communication templates
Internally first, via Slack: a structured message sent as soon as an incident begins, giving all teams (Ops, Support, CSM, top management…) the same information at the same time.
Externally, for our clients. We developed templates for each type of scenario:
- Human error / deployment error
- Critical application bug
- Traffic spike / server overload
- …
No more starting from a blank page under stress. The substance is already there — only the details need adapting.
Example of an email template:
Dear user,
We are writing to inform you that [Your platform name] was temporarily unavailable following an error that occurred during a maintenance / deployment operation.
The issue has been identified and resolved by our teams. The service has now been fully restored and is operating normally. We are implementing a specific reinforced monitoring measure to prevent this from recurring in the future.
We would like to sincerely apologise for this unexpected service interruption and any inconvenience it may have caused.
The Tech Team
And we arrive at the heart of the incident: the root cause investigation.
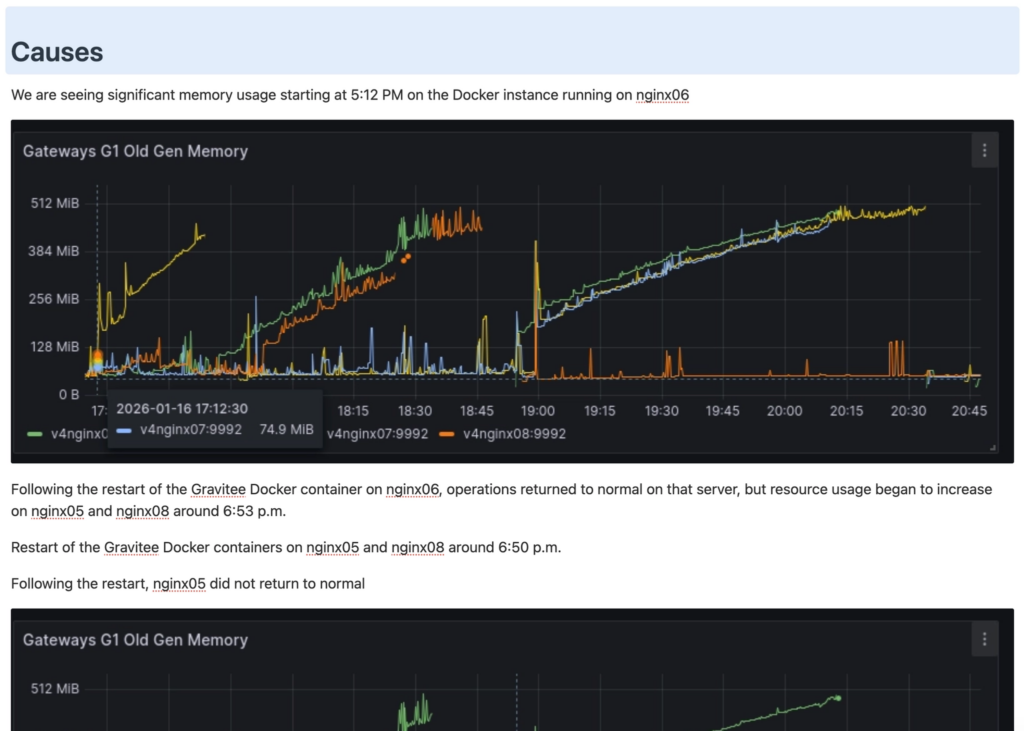
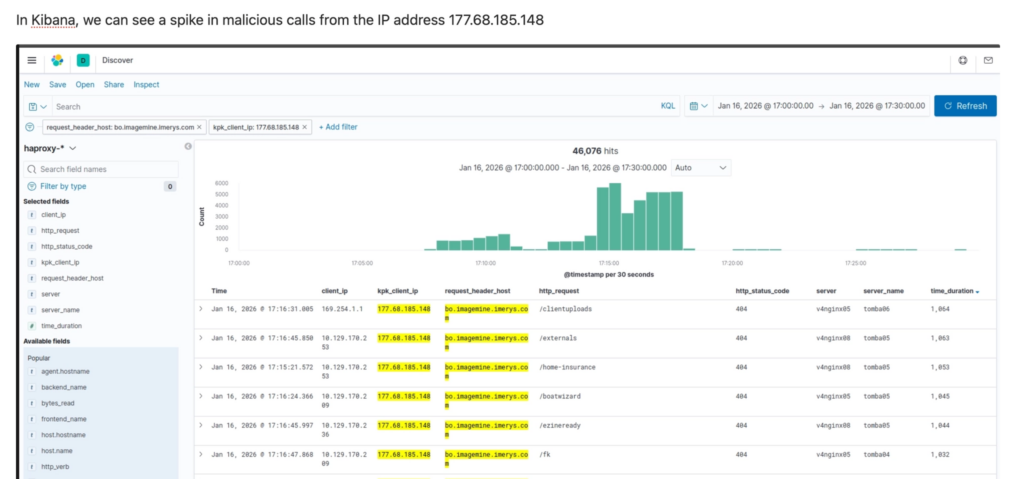
Root cause investigation
We built an investigation toolset checklist along with flow diagrams and architecture maps. The goal is to speed up resolution regardless of who is mobilised. The checklist covers recent changes in our infrastructure, which logs to check, key monitoring dashboards, and a FAQ database of past incidents to look for similarities:
Extract:
[ ] What has changed since the incident? Claranet? Azure? Platform.sh?
[ ] Kibana HA Proxy / Refront Logs / NGINX Logs on restore
[ ] Prometheus / Grafana: servers, DB, ES, NetApp
[ ] Azure Dashboard
[ ] Search for similar incidents in this database: Incident Concept
[ ] FAQ on this type of incident
[ ] …
This is without doubt the hardest part. I try to encourage the following pattern: brainstorm several hypotheses, assign each hypothesis to one person to confirm or rule out, and iterate until the root cause or causes are identified.
A daily standup to organise the team’s day
And the last work standard — to keep the team moving forward and ensure scheduled remediations are seen through to completion — the Ops team has its own daily meeting, just like the development teams.
Here is our standard — 20 minutes every morning from 9:10 AM:
Who is available today for incident management? Who is absent?
→ Ensure full monitoring coverage from 8:30 AM to 6:00 PM
Incident review
→ Follow-up on scheduled remediations: which countermeasures still need to be completed
On-call overnight
→ Was there a call? Does a false positive need to be reviewed?
Review of planned platform operations for the day
→ Reminder for the team, make sure everything is ready
Long-running projects (migration, security…)
→ Any blockers or progress to report?
Individual round table
→ What does each person have planned for today, who needs help…
The hardest part for the teams
Writing to gain perspective
At first, the teams saw all these changes as bureaucracy and a waste of time:
– Do we really have to write all this down? And what’s the point of logging an action that didn’t work?
True, it takes a few minutes to write things up. But it’s also an opportunity to take just a small step back from the situation:
– But when did the incident actually start? At 11:23 AM when I read the alert email, or at 8:30 AM when our users started their day?
And ultimately, we are building our knowledge base:
– Wait, hasn’t this incident happened before?
And this point proves even more essential for training AI models (see next steps below).
Getting to the root of the problem
But the hardest part remains identifying the real root cause(s).
Let’s take an example of an incident: « The bulk email sending function has stopped working ». Why?
– Because the mail scheduler crashed → Not the root cause
– Because it ran out of memory → Not the root cause
– Because we introduced a retry mechanism that no longer respects the Max Attempts = 5 limit since version 4.6.2, creating an infinite loop and an out of memory error → Bingo, that’s the root cause.
At first, the team often stops at a first or second-level apparent cause. It will take weeks — sometimes longer — for the whole team to correctly qualify an incident without mixing up: visible symptom, user impact, and root cause. This is entirely normal; it’s a mechanism that seems simple at first glance but really isn’t.
Picking your battles
As a manager or CTO, you’d want to fight every single incident — but sometimes you also have to accept letting go: when teams are already mobilised on several major workstreams, or when the probability of recurrence is too low to justify the investment. It’s a choice, not a surrender.
Sometimes too, you’ll simply be unable to identify the cause: because logs are missing, because nobody thought to take a thread dump…
Ultimately, what’s encouraging is that little by little, the habits form. It’s no longer necessary to check every time whether the incident was logged or whether the communication was sent… And a habit is a bit like brushing your teeth: at first it feels complicated and tedious, and after a few months you don’t even notice you’re doing it. And the first resolved incidents start bearing fruit — the number of incidents decreases relentlessly. These results are as much encouragement to keep improving our practices.
Having the right reflexes when facing an incident is great. But when things escalate — multiple alerts in parallel, overwhelmed teams, clients calling — you need something more: a clear process to keep a cool head and coordinate effectively. That’s what we built next.
Staying calm even when the house is on fire: the process guides us
Before we structured all of this, a critical incident often looked like: parallel conversations on Slack, Support calling Ops, a barrage of questions about where things stood, whether it was « moving forward« … Firefighting.
The goal of our process: for everyone to know exactly what to do, to bring a degree of calm to the action so that our minds stay focused on resolution. And for the other teams — the CEO, support, CSMs — to feel confident that the situation is being handled.
Here is our simplified end-to-end process:
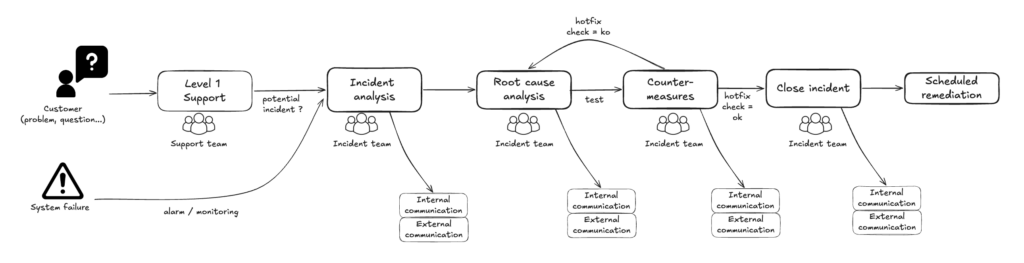
Mobilising and communicating: Incident Analysis
An incident is flagged by a client, a monitoring probe, or someone internally. An incident lead is immediately named. They are responsible for:
- ensuring the team is mobilised on a video call
- opening the incident: the Notion page is created and everything is logged there
- communicating in the #incident Slack channel every 20 to 30 minutes, and proposing external communication depending on severity
Result: every person in the company is kept informed in real time, from the moment the incident is raised through to resolution. No one needs to go hunting for updates. Our colleagues know the tech teams are on it and keeping them informed — that builds trust.
Root cause investigation and countermeasures
The mobilised technical experts investigate causal hypotheses, verify them on the ground, and share ideas through the dedicated channel. Initial countermeasures are tested.
The incident lead is not there to solve the problem themselves — but they ensure all avenues are properly explored, communicate in real time on resolution progress, and shield the team from external interruptions.
Closing the incident
The incident lead shares the good news and ensures that all next steps (Scheduled Remediation) each have a clear owner and a date: preparing a permanent fix, a remediation action on the servers… They also make sure the incident page is clear and up to date.
Back to normal operations.
When it’s truly critical
When an incident proves critical for our users, an escalation process is triggered to immediately mobilise the full team needed:
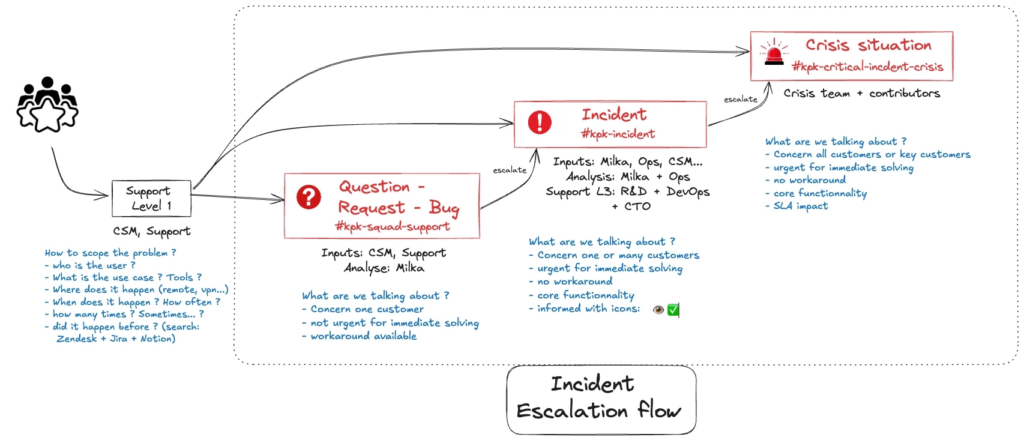
My smartphone starts ringing, along with those of other identified managers. At that point, I stop whatever I’m doing and join the dedicated video call opened specifically for the crisis, to take the lead on the incident. Once the team is mobilised, the process is the same as for a minor or major incident — the difference is the speed and the level of escalation.
Our next steps
First, we built our RAG AI, fed with over 400 incidents patiently documented in our Log as well as exchanges across our various Slack channels. This clean data corpus allows us to use AI to:
- help us resolve incidents faster
- identify patterns and recurrences: which incidents are most frequent in which parts of the infrastructure…
- anticipate future failures: which problems seem linked to certain periods of the year, to month starts or ends…
(more on this here: RAG AI powered by field data)
And to fight against « cognitive debt » (a bit like a firefighter who loses their ability to fight fires if they never get to practice), we decided to run simulated blank incidents to avoid getting rusty.
To close this article, our next step — still at prototype stage — is Agentic AI: deploying autonomous agents to monitor and respond to alerts. By cross-referencing Sentry notifications, Grafana alerts, and various logs, an agent can identify whether a proven solution exists and propose it to an Ops engineer. The human remains at the heart of the process.
Many thanks to Xavier, Benjamin, Pierre, Titouan and Bénédicte, the main contributors to this initiative, to Thomas our CEO for his trust, and to our clients for their patience 🙏
Laisser un commentaire